|
A sample concentration, obtained from an ELISA, is dependent upon the interaction between an analyte and the ELISA’s antibodies. Since many factors may influence this interaction, applying key metrics is essential to evaluate assay performance and to validate the results. Learn about:
|

|
The standard curve represents the detectable concentration range of an analyte and involves a serial dilution of the purified analyte (e.g. recombinant protein). The concentration of each standard is plotted against the mean readout value, often a measurement of optical density (OD). When graphed, the linear portion of the curve is used to calculate the amount of analyte in unknown samples. |
|
The lower limit of detection, or minimal detectable dose (MDD),
|

|

|
Intra-assay variability measures the consistency of replicate samples within an experiment. %CV best if <10%. Inter-assay variability measures consistency of replicate samples between experiments. %CV best if <15%. Coefficient of variance (%CV) based on sample concentration.
|
|
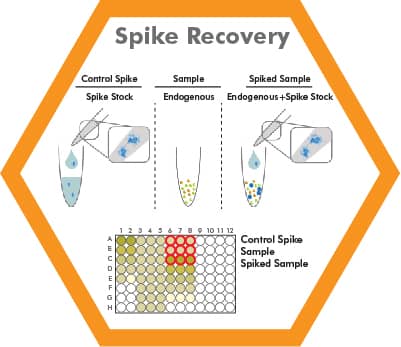
A known amount of analyte is spiked into the biological sample and tested in an ELISA. The resulting concentration or “recovery” of spiked analyte can be determined. If the recovered value differs significantly from the expected concentration, then a factor in the biological sample may be interfering. % Recovery is acceptable between 80–120%.
|

|

|
Biological sample or spiked sample is serial-diluted, such as 1:2, 1:4, and 1:8. If the analyte concentration in the dilution series falls within the detection range of the assay, then the normalized analyte concentrations (taking into account the dilution factor) should be the same. In the example on the left, the biological sample represented by the yellow line displays acceptable assay linearity whereas the biological sample represented by the blue line suggests that interfering factors prevented the accurate measurement of the analyte. Assay Linearity is acceptable between 80–120%.
|